Fleet Management ROI: Measure Gains Across Deliveries & Returns
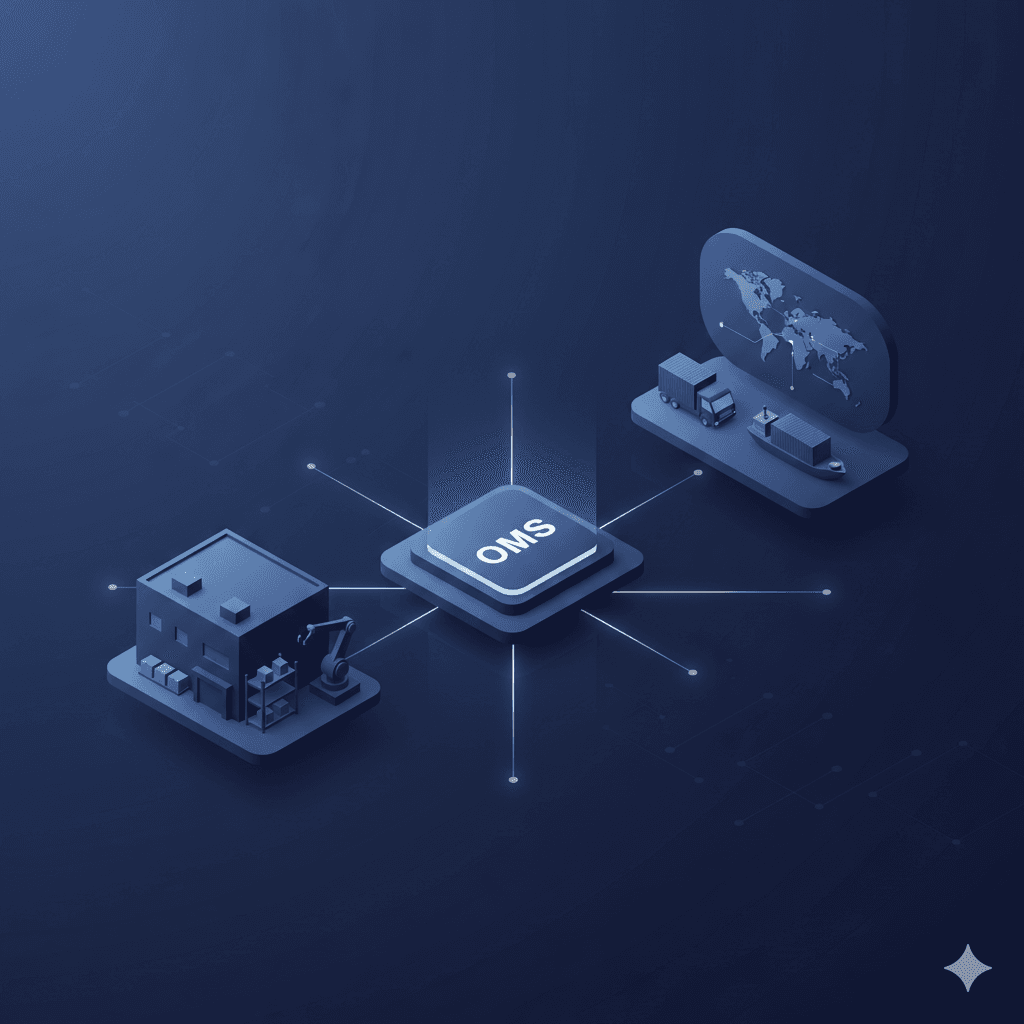
Table of Contents
Share On
Fleet Management ROI: Measure Gains Across Deliveries & Returns
TL;DR
- Fleet ROI is a full-loop metric that includes forward deliveries and reverse pickups
- Order management system supply chain decisions directly affect route density, reattempts, and cost per stop
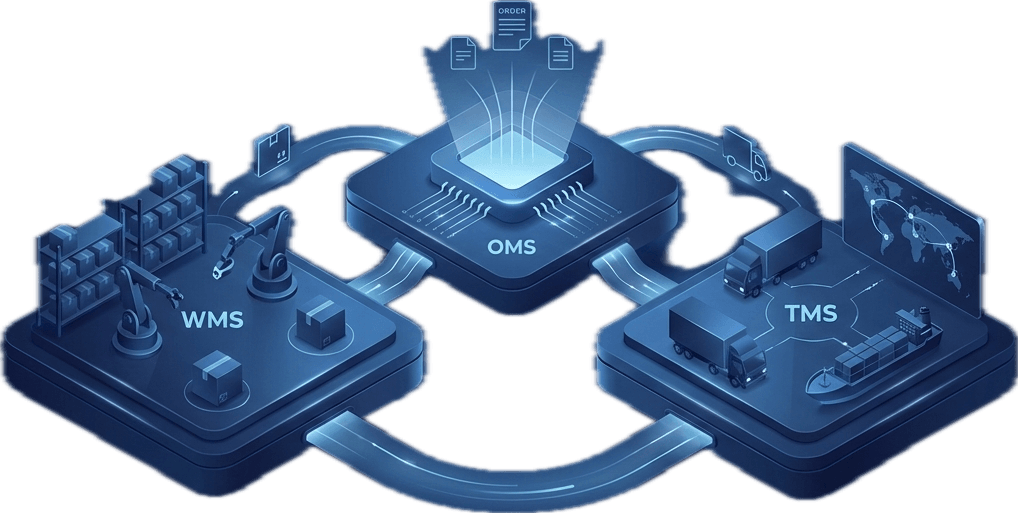
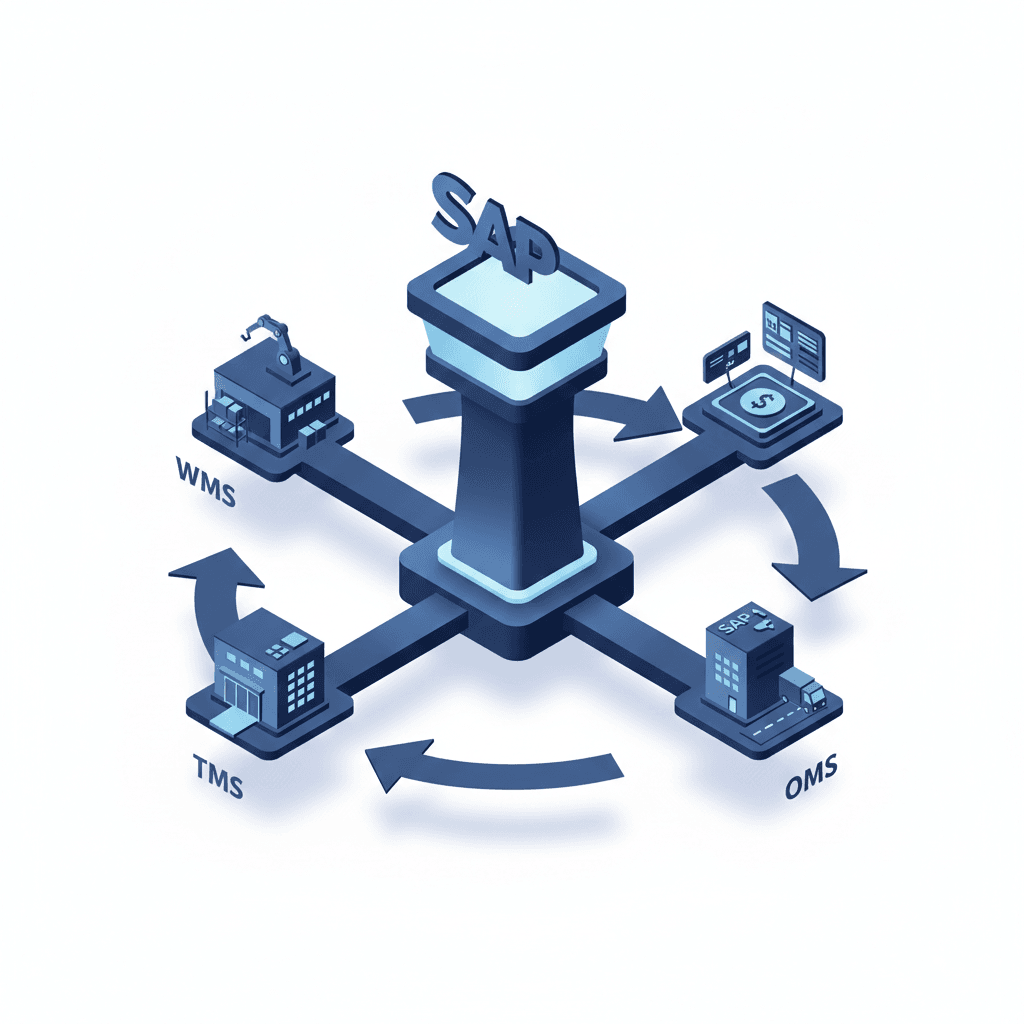
- OMS vs WMS vs TMS: OMS decides and coordinates, WMS executes warehouse and store work, TMS executes routing, dispatch, delivery, and pickups
- Measure ROI using a baseline and incremental impact: cost per successful stop, first-attempt success, pickup cycle time, and on-time promise rate
- The biggest ROI gains often come from fewer exceptions, not just lower fuel usage
Introduction
A customer orders online at 3 PM. The site promises delivery tomorrow.
The OMS routes fulfilment to a nearby store to hit the promise.
It sounds efficient. But the ROI questions start immediately.
- Did the store have accurate inventory?
- Was the order packed before cutoff?
- Did the carrier pick up on time?
- Did delivery succeed on the first attempt?
- If the customer returns the item, can it be collected in the same area without a special trip?
Fleet Management ROI is not a dispatch-only story. It is the outcome of the entire order lifecycle in supply chain management.
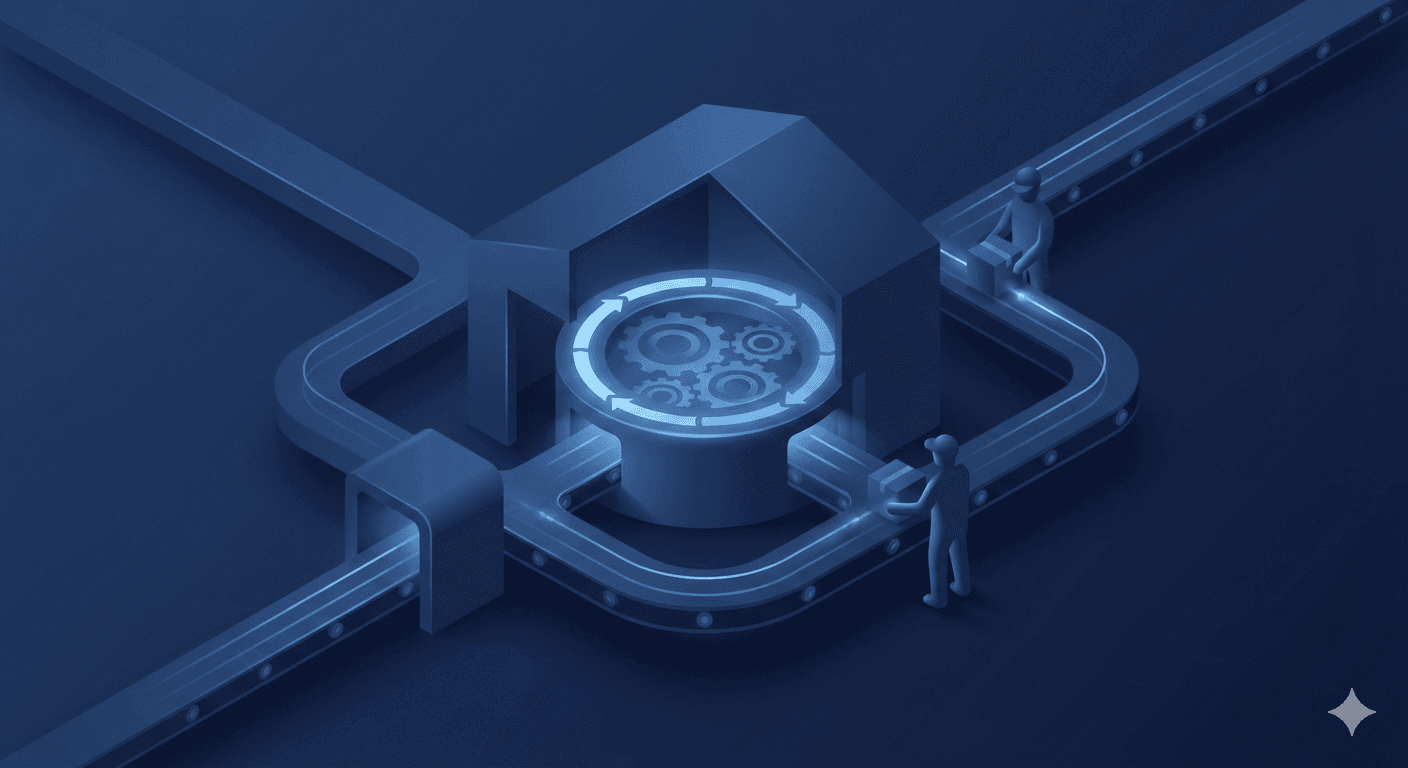
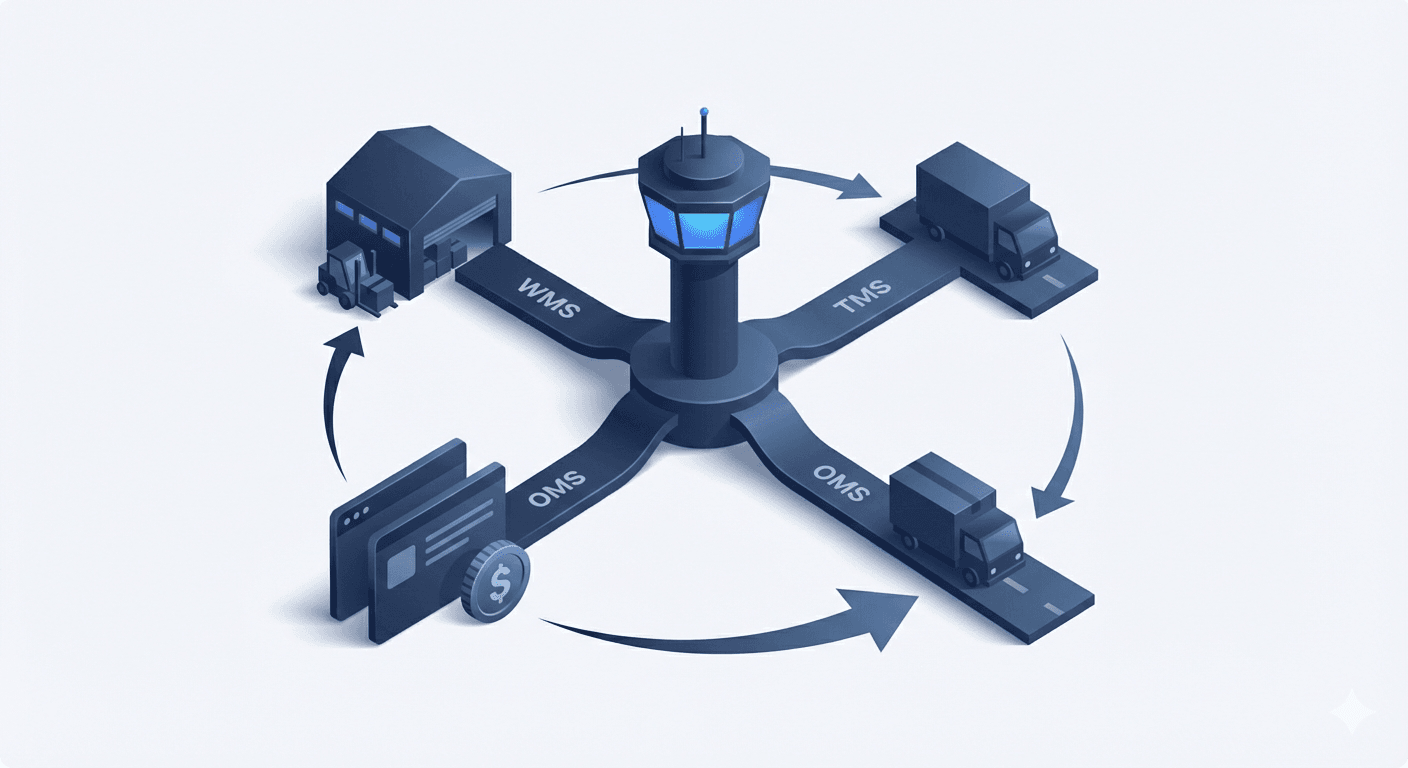
The control tower view connects decisions in OMS, execution inside the node in WMS, and execution on the road in TMS. Without that connection, teams measure the wrong metrics and fix the wrong problems.
This guide explains how to measure ROI across deliveries and reverse pickups using practical, operational metrics.
What an OMS controls in the supply chain
If you want better fleet ROI, you need fewer surprises. The OMS reduces surprises by controlling the decision layer.
An Order Management System acts as the control tower for orders. It decides what should happen and when, while execution happens elsewhere.
Order capture and normalisation
Orders arrive from multiple sources:
- Website
- Marketplaces
- POS systems
- B2B channels
The OMS captures these orders and standardises the data.
Why it matters for fleet ROI: bad inputs create wasted trips.
Order validation
Validation ensures orders are serviceable before dispatch planning begins.
Examples include:
- Address completeness and format
- Phone number availability
- Delivery zone validation
- Payment status checks
Every failed delivery caused by address or validation errors is a direct ROI leak.
Inventory availability and ATP
ATP stands for Available to Promise.
It answers not “do we have stock somewhere,” but “can we commit stock and still meet the promise.”
ATP typically considers:
- On-hand stock
- Reserved stock
- Safety buffers
- Inbound stock (depending on policy)
When ATP is wrong, you get re-routing, cancellations, and rushed dispatch, all of which increase cost per successful stop.
Allocation and fulfilment node selection
Allocation reserves inventory. Node selection decides where fulfilment happens.
Nodes may include:
- Warehouses
- Retail stores
- 3PL locations
- Dark stores
This directly affects:
- Distance per order
- Stop density per route
- Cutoff feasibility
- Split shipment frequency
Better node selection often improves both cost efficiency and ETA accuracy.
Orchestration across fulfilment and shipping
Orchestration coordinates the sequence of work.
The OMS:
- Releases tasks to WMS or store workflows
- Requests shipping or pickup creation
- Tracks status events
For fleet ROI, orchestration prevents dead miles caused by poor timing, such as dispatch planned before packing is complete.
Exception workflows
Exception workflows are the OMS safety net.
Common exceptions that impact fleet ROI include:
- Packed orders missing cutoff
- Pickup scheduled but parcel not handed over
- No scan after pickup
- Address correction required
- Partial allocation due to stock mismatch
When exceptions are handled early, reattempts and special trips drop significantly.
What an OMS does not control
Fleet ROI suffers when teams assume OMS controls everything. It doesn’t.
Warehouse execution details
This is WMS territory.
WMS executes:
- Picking and packing
- Inventory accuracy at bin level
- Wave planning and batching
- Putaway and replenishment
- Packing station throughput
OMS requests fulfilment. It does not run the floor.
Transportation execution
This is TMS territory.
TMS executes:
- Route planning and stop sequencing
- Driver assignment and dispatch
- Delivery attempts and proof of delivery
- Reverse pickup routing and confirmation
OMS requests shipments and pickups. TMS runs movement.
Why boundaries matter for ROI
A drop in delivery success may look like a driver issue, but the root cause could be:
- Over-aggressive promise dates
- Wrong node selection
- Inventory mismatch causing repacking
The control tower view prevents blame and guides effective fixes.
OMS vs WMS vs TMS
This comparison helps align teams.
OMS (Order Management System)
Role: decides and coordinates Focus: ATP, promise dates, allocation, orchestration, exceptions
Example: routing an order to a nearby store to meet next-day delivery.
WMS (Warehouse Management System)
Role: executes fulfilment inside a node Focus: picking, packing, inventory accuracy, handoff readiness
Example: confirming packing before the 5 PM cutoff.
TMS (Transportation Management System)
Role: executes transportation Focus: routing, dispatch, delivery attempts, reverse pickups
Example: bundling deliveries and reverse pickups in one zone to reduce kilometres.
A strong ROI model uses signals from all three systems.
Key workflows where OMS matters most
Fleet ROI improves when orders are easy to deliver and easy to return.
ATP and inventory availability
Strong ATP logic reduces:
- Cancellations
- Emergency re-routing
- Forced split shipments
Dispatch planning becomes more stable.
Promise date
The promise date is both a trust contract and a planning constraint.
Over-promising creates:
- Overtime
- Late departures
- Higher first-attempt failures
Realistic promise logic makes routes predictable.
Backorders
Backorders fragment routes and increase cost per order.
OMS policies should define:
- When backorders are allowed
- How inbound stock is allocated
- How ETAs are communicated
Split shipments
Splitting increases handling and last-mile stops.
OMS rules should answer:
- When to split
- When to consolidate
- How to message customers
Cancellations
Late cancellations destroy route density.
OMS should support:
- Early validation gates
- Holds before dispatch creation
- Clean reason codes
Returns initiation and reverse pickups
Reverse pickup ROI depends on clean initiation:
- Eligibility checks
- Pickup address confirmation
- Linking returns to original orders
- Pickup slots aligned with route planning
OMS initiates, TMS collects, WMS confirms receipt.
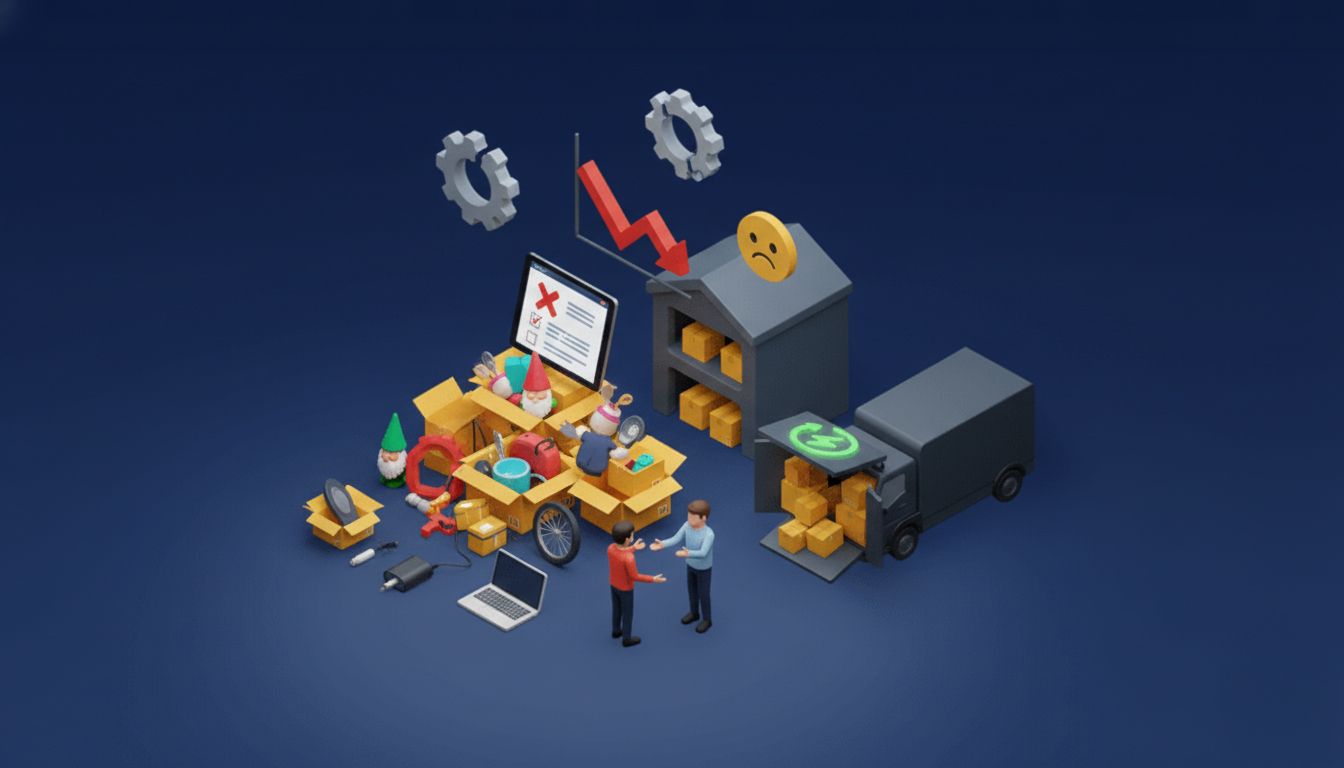
Common mistakes teams make
Using OMS like a WMS
Forcing warehouse execution into OMS screens creates poor workflows and unstable dispatch.
Fix: let OMS coordinate and WMS execute.
Missing exception management
Exceptions handled in chats and spreadsheets lead to reattempts and special trips.
Fix: build exception queues with ownership and SLAs.
Ignoring inventory latency
Inventory latency makes ATP unreliable, leading to:
- Misrouting
- Failed picks
- Missed cutoffs
Fix: measure latency, implement reservations, use buffers.
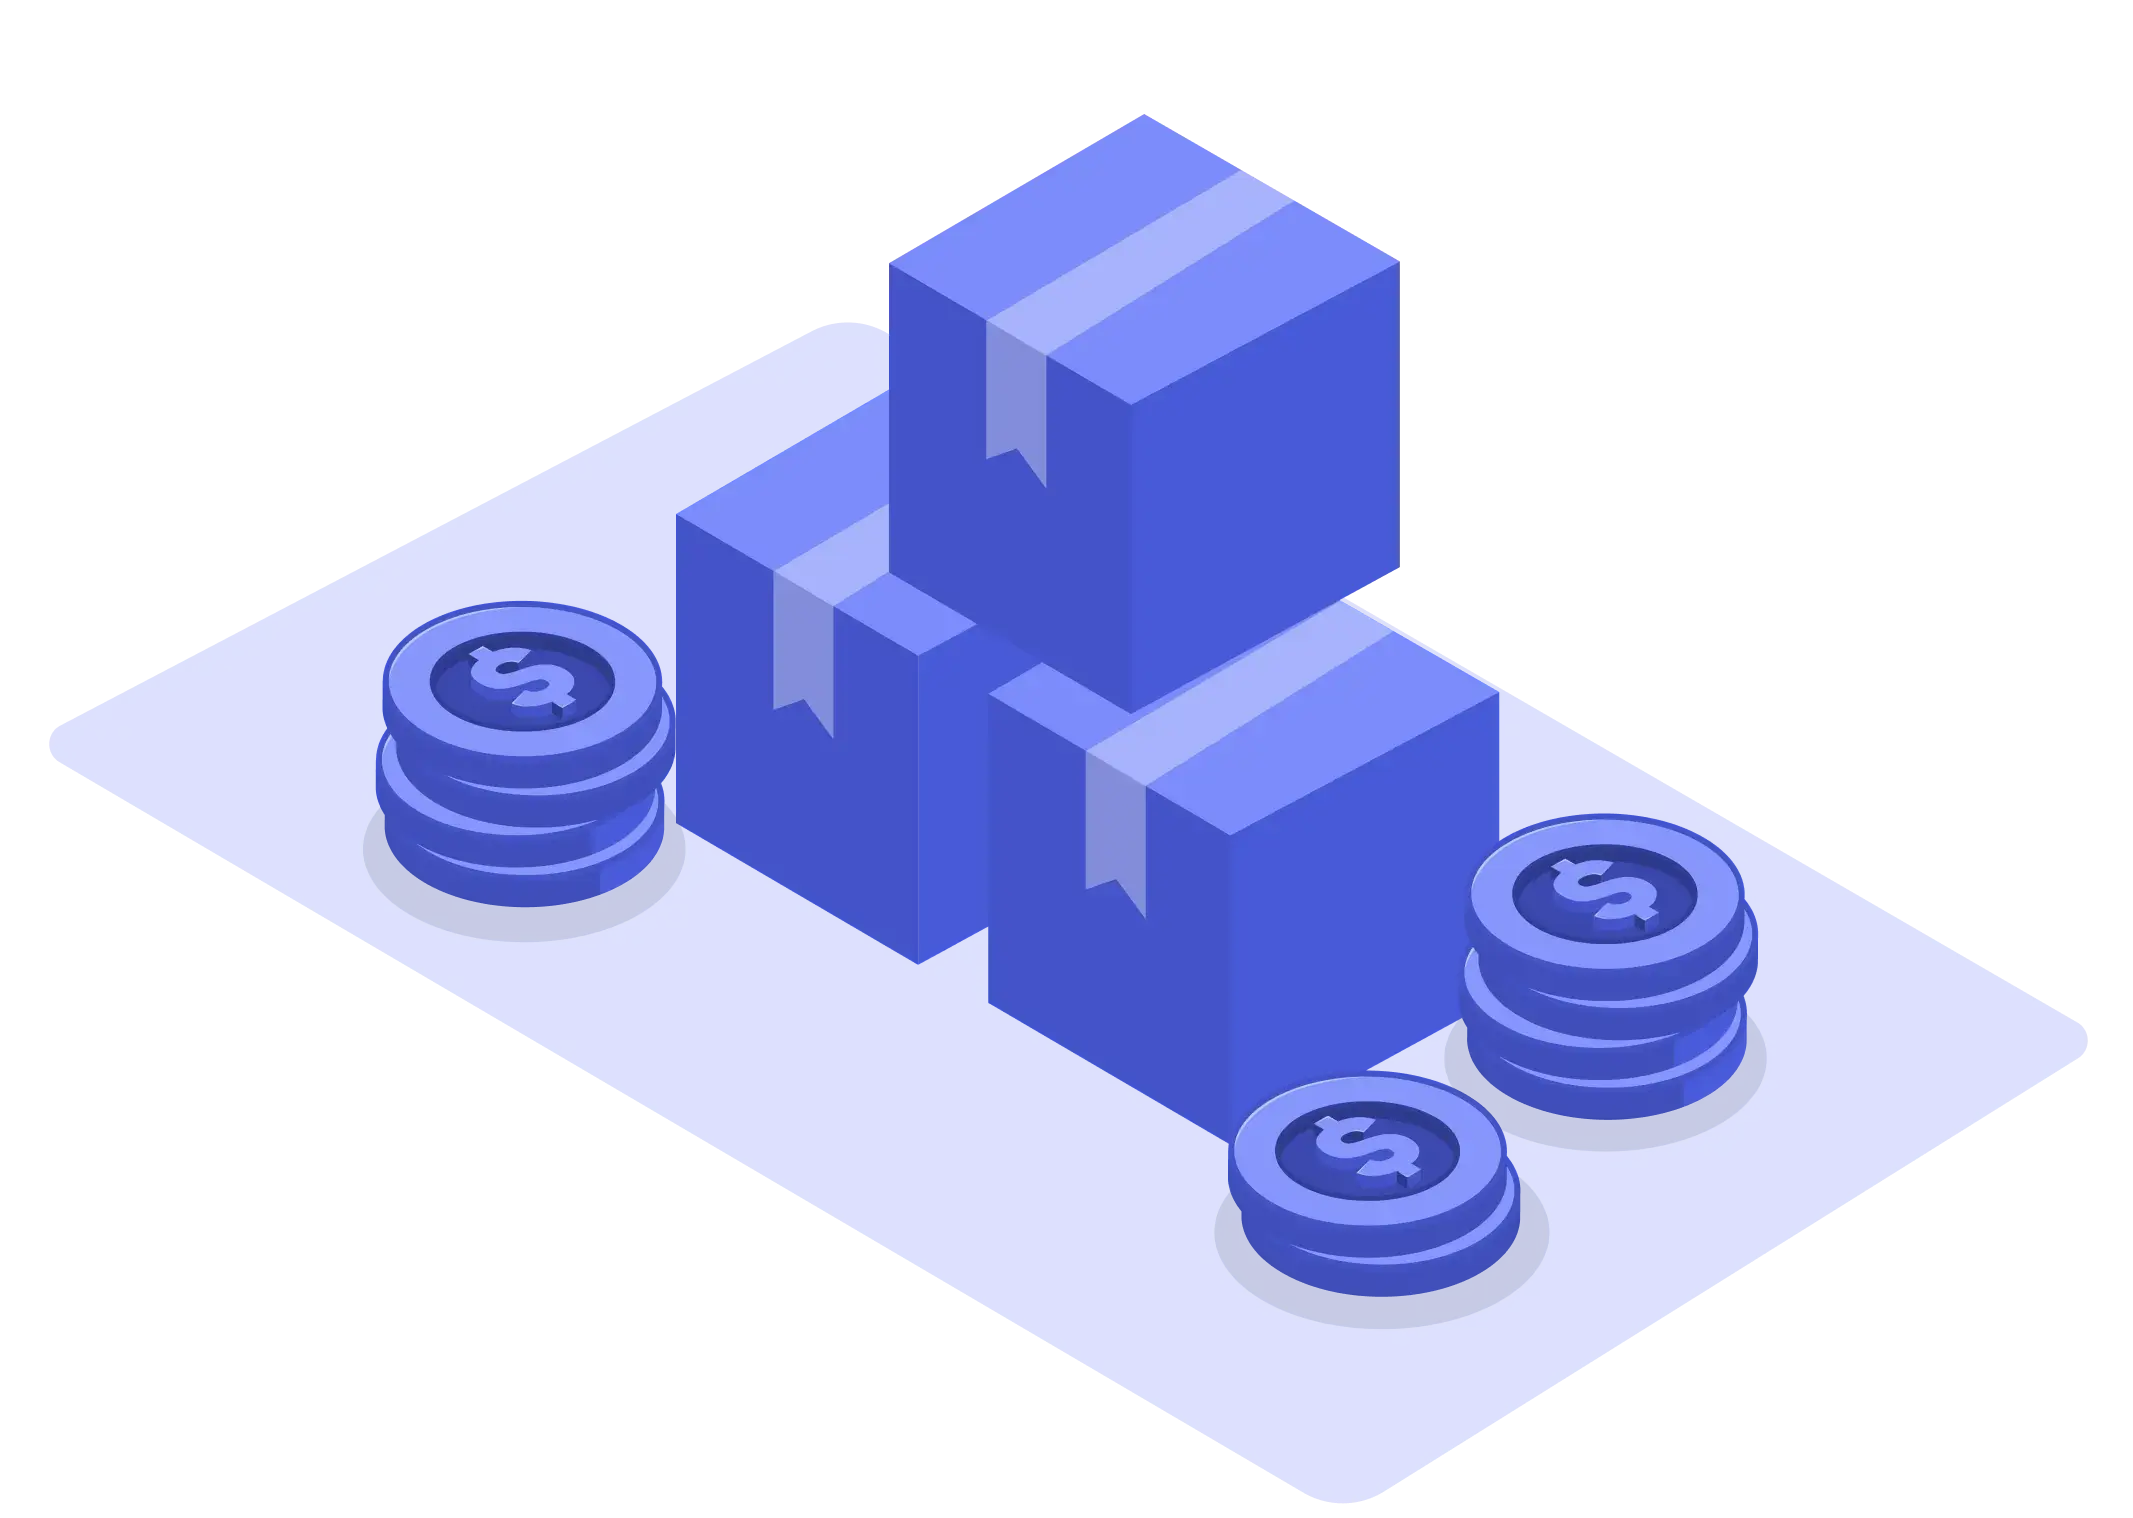
Measuring only fuel or kilometres
Fuel savings are visible. Reattempt savings are often larger.
A single failed delivery can cost more than several kilometres of fuel.
Treating reverse pickups separately
Returns planned as special runs inflate cost.
Fix: integrate pickups into forward route planning where possible.
What to look for when choosing an OMS
Even for fleet ROI, OMS selection matters.
Capabilities checklist
Look for:
- Multi-channel order capture
- ATP with reservations
- Node selection rules
- Promise logic tied to cutoffs
- Split shipment controls
- Cancellation rules with reason codes
- Returns initiation workflows
- Exception handling with SLAs
Integration readiness
ROI measurement needs clean timestamps.
Check for:
- APIs and webhooks for near-real-time updates
- Consistent IDs across order, shipment, package, and return
- Clean integration with WMS and TMS
- Carrier and pickup event ingestion
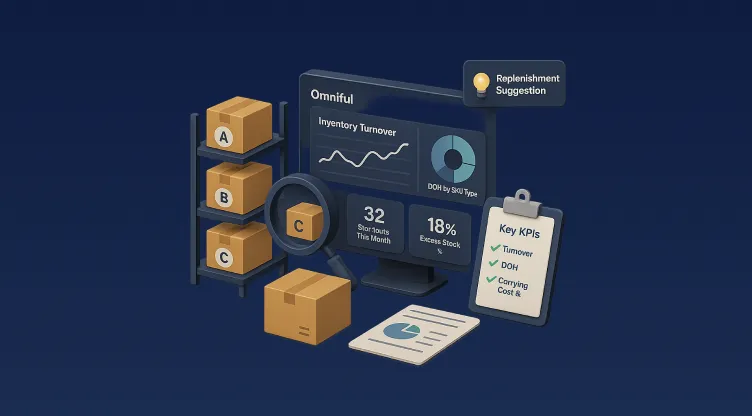
Reporting and measurement support
You should be able to calculate:
- Cost per successful stop
- First-attempt delivery success rate
- On-time to promise date
- Reverse pickup success and cycle time
- Exceptions by type and ageing
Without this, ROI becomes opinion-based.
Control Tower Cheat Sheet
Controls
- Order capture and validation
- Inventory availability and ATP
- Fulfilment node selection
- Promise date logic
- Returns eligibility and initiation
- Exception workflows
Coordinates
- Orchestration across WMS and TMS
- Shipment and pickup timing
- Split and cancellation policies
- Status visibility
Does not do
- Warehouse execution details
- Transportation execution
- Carrier performance itself
Five metrics to watch
- Cost per successful stop
- First-attempt delivery success rate
- On-time to promise date
- Kilometres and idle time per stop
- Reverse pickup cycle time
FAQ
How do I measure fleet ROI beyond fuel savings?
Track cost per successful delivery and per completed return, including reattempts, driver time, and exception handling overhead.
Why does an order management system supply chain impact fleet ROI?
Because OMS decisions shape node selection, promise dates, splits, and cancellations, which determine route density and reattempt risk.
What is order management in supply chain in simple terms?
It is how orders are captured, validated, allocated, and coordinated across fulfilment and delivery systems.
OMS vs WMS vs TMS — how do they affect ROI?
OMS stabilises the plan, WMS ensures readiness and accuracy, and TMS executes routes and captures outcomes.
What KPIs matter most for reverse pickups?
Pickup success rate, attempts per pickup, pickup-to-receipt cycle time, and cost per collected return.
What causes the biggest hidden last-mile costs?
Failed first attempts, wrong addresses, missed cutoffs, inventory mismatches, and unmanaged exceptions.
How do backorders affect fleet cost?
They fragment routes and reduce consolidation, increasing cost per order.
How do exception workflows improve ROI?
They surface issues early, preventing reattempts and special trips.
Conclusion
Fleet Management ROI across deliveries and reverse pickups improves when operations behave like a control tower.
OMS controls the decision logic. WMS executes fulfilment inside the node. TMS executes routing, dispatch, delivery, and reverse pickups.
A practical next step is to map one end-to-end loop and baseline the five core metrics. Use timestamps from OMS, WMS, and TMS to identify where time and cost accumulate. Then fix one constraint at a time.
If you manage high volumes, platforms like Omniful can support this control tower model by connecting orders, inventory, fulfilment, and transport signals in one place.
Keep the focus on measurable outcomes: fewer reattempts, tighter ETAs, and a faster return loop.
About Omniful
Omniful (Omniful.ai) is a unified, cloud-based supply chain execution platform that brings OMS (Order Management System), WMS (Warehouse Management System), TMS (Transportation Management System), POS, and PIM/catalog operations into one connected workflow. Built for modern retailers, D2C brands, marketplaces, and 3PL/logistics teams—especially across the Middle East—Omniful helps operations run faster with real-time inventory visibility, smarter order routing and orchestration, warehouse execution (receiving, putaway, picking, packing), and delivery planning with live tracking, exceptions, and returns workflows. With flexible APIs and plug-and-play integrations across sales channels and shipping partners, Omniful enables teams to scale fulfillment without fragmented tools. omniful.ai