Inventory Analysis: Methods, Metrics, & KPIs

Table of Contents
Smarter Inventory, Stronger Profits
Inventory analysis helps businesses strike the right balance between stock availability and cost efficiency. This guide covers:
- Why inventory analysis matters for profitability and operations
- Key methods like ABC, HML, VED, SDE, and FSN
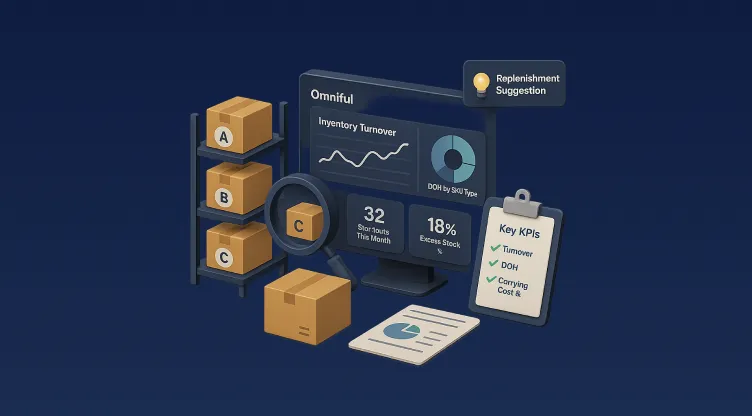
- Metrics and KPIs such as inventory turnover, DIO, GMROI, stockout rate, sell-through rate, and obsolescence
- Practical insights to forecast better, prevent waste, and boost ROI Learn how Omniful's Inventory Management system simplifies analysis with real-time visibility, automation, and data-driven decisions—so you can reduce risks and improve performance.
What is Inventory Analysis?
Definition and Importance of Inventory Analysis
Inventory analysis is the systematic evaluation of a company's stock levels, movements, and management practices. This process aims to optimise inventory holdings, ensuring that the right products are available in appropriate quantities at the right time. Effective inventory analysis aids in optimising stock levels, improving purchasing decisions, and enhancing cash flow management.
How Inventory Analysis Impacts Business Profitability
Proper inventory analysis directly influences a company's profitability. By maintaining appropriate stock levels, businesses can reduce carrying costs, avoid stockouts, and decrease the likelihood of excess inventory becoming obsolete. You can create other revenue-gen sectors as you'll have more capital with you, as efficient inventory turnover prevents your capital from being tied up in your stock. Accurate inventory forecasting techniques help companies match their inventory levels to the actual market demand; thereby boosting sales figures and enhancing customer satisfaction.
Common Inventory Challenges and How Analysis Helps
Businesses face multiple inventory management difficulties, including excess stock levels, while simultaneously experiencing shortages and inaccurate data combined with variable customer demand patterns. Too much inventory can lock up money and cost a lot to store, while not having enough can lead to missing sales and unhappy customers. If the inventory data is off, it can lead to bad choices, and when customer demand changes quickly, it's hard to keep the right amount of stock. Using solid inventory analysis & keeping an eye on key management numbers can help businesses tackle these issues/challenges by giving them a more clear picture of their stock, improving forecasts, and supporting better decisions.
Common Inventory Analysis Methods
ABC Analysis (Activity-Based Classification)
ABC analysis serves as an inventory classification method that sorts stock into three different categories according to consumption value. This Inventory analysis method
uses the Pareto principle, demonstrating that a small percentage of items represents most of the value.
- A items represent the top 20% of inventory, but they generate 70% of annual consumption value. A items require precise monitoring and detailed documentation.
- B items are of moderate importance, making up about 30% of the items and 25% of the value. They need less stringent control than A items.
- C items are the least valuable, comprising 50% of the items but only 5% of the value. These items have the simplest controls and minimal records.
This approach allows businesses to focus their inventory management efforts on high-value items whilst maintaining appropriate controls for less critical stock.
HML Analysis (High, Medium, Low Value Segmentation)
HML analysis categorises inventory based on unit cost rather than consumption value. This method organises products into High, Medium, and Low categories according to their individual price points.
The implementation process involves:
- Listing all inventory items with their respective costs
- Arranging items in descending order based on unit costs
- Calculating total consumption value by multiplying unit cost by annual demand
- Establishing cutoff points to segment items into the three categories
This approach helps prevent overstocking and stockouts of the most expensive items, allowing for more precise financial control of inventory investments.
VED Analysis (Vital, Essential, Desirable Classification)
VED analysis classifies inventory based on criticality rather than cost or consumption. This Inventory analysis method categorises items as Vital, Essential, or Desirable depending on their importance to business operations.
To conduct VED analysis:
- Identify all inventory items, including raw materials, finished goods, and consumables
- Classify each item based on factors such as usage rate, lead time, availability, and cost
- Review and adjust inventory management strategies accordingly
This inventory forecasting technique is particularly valuable for businesses where certain items are critical to operations regardless of their financial value.
SDE Analysis (Scarcity-Based Categorisation)
The SDE analysis method evaluates inventory item availability by classifying them according to their procurement difficulty as Scarce, Difficult or Easy to obtain. Org benefit from this Inventory forecasting technique when operating under supply chain uncertainties and material shortages.
The primary principles of SDE analysis include:
- Focus on availability in the market, considering factors like supply chain reliability and lead times.
- Risk mitigation for items that are challenging to procure.
This Inventory analysis method helps orgs prioritise procurement efforts and develop contingency plans for items that may face supply constraints.
FSN Analysis (Fast, Slow, and Non-Moving Items)
Inventory classification, according to FSN analysis, depends on the speed of movement & duration in storage. The inventory analysis method segments stock into three distinct categories:
- Fast-moving inventory: High turnover items (turnover ratio of 3 or higher), generally make up less than 20% of the total inventory.
- Slow-moving inventory: Items with moderate turnover (ratio between 1 and 3), constituting about 35% of total inventory.
- Non-moving inventory: Items with minimal movement (turnover ratio below 1), making up 60-65% of total inventory.
Classification looks at how fast items are used, how long they sit in the warehouse, and the time frame for analysis. This way of analysing inventory helps spot deadstock and adjust inventory levels according to what’s actually moving.
Essential Inventory Analysis KPIs & Metrics
The evaluation of inventory performance using Inventory management key performance indicators (KPIs) and metrics forms the core of successful inventory management practices. Quantitative metrics deliver essential insights which inform strategic decision-making processes and lead to operational enhancements.
Inventory Turnover Ratio
The inventory turnover ratio measures how often a business sells through and replenishes its inventory during a specific period. This essential KPI for inventory analysis evaluates performance in business inventory management operations. Businesses with higher ratios demonstrate better performance because their products tend to sell quickly. Reduced ratios may indicate excessive inventory levels, outdated products or a decrease in sales volume.
Inventory Turnover = COGS/Avg Inventory
Days Inventory Outstanding (DIO)
The Days Inventory Outstanding (DIO) KPI measures how long inventory remains unsold in a company before being sold. Through inventory management KPIs, companies can monitor how long their capital remains tied up in inventory. Lower Days Inventory Outstanding figures indicate that a company manages its inventory with higher efficiency. High inventory management numbers suggest that products in the stock are facing sales delays or becoming outdated.
DIO = (Average Inventory ÷ Cost of Goods Sold) × 365
Monitoring DIO trends enables companies to detect seasonal patterns and modify their inventory forecasting methods accordingly.
Gross Margin Return on Investment (GMROI)
GMROI determines inventory purchase returns through the calculation of gross profit generated for each $ invested in inventory. This advanced inventory management KPI integrates both profitability measures and inventory efficiency assessments. A GMROI greater than 1 indicates the company is selling inventory for more than its cost. Higher GMROI values suggest better inventory investment decisions.
GMROI = Gross Margin ÷ Average Inventory Cost
This metric is particularly valuable for retailers and distributors seeking to optimise their product mix and inventory levels and improve inventory forecasting techniques.
Stockout Rate & Backorder Rate
The stockout rate indicates how often items become unavailable when customers wish to buy them, while the backorder rate monitors the orders received for items that are currently out of stock.
These complementary metrics reveal:
Customer service levels and potential lost sales
- Accuracy of inventory forecasting techniques
- Effectiveness of reordering systems
By monitoring these rates, businesses can achieve a balance between service levels and inventory costs, which forms an essential part of a thorough inventory analysis.
Sell-Through Rate & Available to Promise (ATP)
The sell-through rate determines the fraction of received inventory that is sold during a set period. ATP represents the number of products that can be delivered to the consumers while considering current order commitments.
Sell-through rate calculation:
(Number of Units Sold ÷ Number of Units Received) × 100%
These metrics provide critical insights into:
- Product performance and demand patterns
- Merchandising effectiveness
- Inventory turnover efficiency
Manufacturers and retailers use this inventory analysis method to inform their purchasing choices and develop pricing strategies through data-driven promotional decisions.
Inventory Write-Offs & Obsolescence Rate
Inventory write-offs refer to the value of goods which remain unsellable because they are damaged or stolen or have become obsolete. The obsolescence rate calculates the proportion of inventory items that are no longer sellable because they become obsolete over time.
These metrics highlight:
- Effectiveness of inventory management practices
- Quality of purchasing decisions
- Accuracy of demand forecasting
The examination of this inventory management key performance indicator enables businesses to pinpoint inventory categories with issues and apply specific strategies for inventory evaluation, leading to decreased waste and enhanced profitability.
Final Thoughts
Mastering your stock levels through Inventory Analysis isn't just an operational task; it's the bedrock of profitability & customer satisfaction. The strategic transformation of inventory from a potential liability into a powerful asset requires mastering Inventory analysis methods and maintaining precise KPI tracking while using accurate forecasting techniques. The manual handling of spreadsheets, along with complex calculations and fragmented data, can quickly become overwhelming, which causes your management style to become reactive rather than proactive.
Stop guessing and start knowing. Imagine having crystal-clear visibility into every facet of your inventory performance, effortlessly identifying trends, preventing stockouts, and eliminating costly waste – all from one central hub. It's time to break free from complexity to take your business forward.
Omniful allows you to get the full potential of data-focused inventory management. Use our intuitive Inventory Management system to gain immediate access to all essential inventory analytics discussed here, plus additional features. Take control of your inventory management system to increase profits and permanently transform your operations. Contact us today!


