The Ultimate Unified Dashboard Guide: Key Widgets and Charts That Drive Daily, Weekly, and Monthly Supply Chain Performance

Table of Contents
Share On
Snapshot Summary: What This Guide Unpacks
- Explore how dashboards unify WMS, OMS, and TMS data
- Discover the most valuable KPIs for warehouse, order, and delivery operations
- See which performance charts deliver the most insights across time frames
- Learn how supply chain professionals use dashboards to make daily decisions
- Understand why real-time visibility is essential for enterprise agility
Introduction: Why a Unified Dashboard is the Supply Chain Game-Changer
Today’s retail and e-commerce operators in the MENA region are under pressure. They must fulfil faster, deliver more accurately, and respond to constant fluctuations. It’s no longer enough to rely on spreadsheets or delayed reports. You need a real-time command centre—a unified dashboard—that syncs data from your Warehouse Management System, Order Management System, and Transportation Management System.
This blog walks you through the essential widgets and charts your business should monitor daily, weekly, and monthly to ensure operational excellence across your supply chain. Whether you manage one warehouse or multiple dark stores across the GCC, this guide is your step-by-step walkthrough.
The Foundation: What Is a Unified Supply Chain Dashboard?
A unified dashboard connects multiple systems—such as WMS, OMS, and TMS—into one interface. It transforms raw data into structured, real-time visual insights.
This allows warehouse managers, logistics teams, and business leaders to:
- Monitor real-time inventory turnover
- Track order fulfilment statuses
- Measure delivery efficiency and accuracy
- React instantly to exceptions or disruptions
- Identify trends and take strategic decisions with confidence
It serves as the operational control room—integrating sales, inventory, and delivery data.
Key Features of an Effective Unified Dashboard
Here’s what separates a smart supply chain dashboard from a basic data board:
Real-Time Data Synchronisation
Every second matters. Real-time sync between the Inventory Management System and order data allows you to track backorders, low-stock SKUs, and available units without delay.
Centralised Performance Monitoring
Your dashboard should provide a 360° view of operations. It must include:
- Daily order status updates
- SKU-level stock availability
- Last-mile delivery metrics
- Returns and exceptions
Customisable Widgets
Different roles need different data. Your warehouse team needs to see picker efficiency. Executives want fulfilment costs and delivery SLAs. A good dashboard lets users build views that suit their function.
Predictive Analytics
By using AI-powered forecasting, dashboards can project future trends in demand, shipping costs, and return rates—especially useful for seasonal planning in MENA markets.
Essential Daily Widgets: Track What’s Happening Right Now
Daily insights are critical for responsive decision-making. Here are the widgets that drive real-time operations:
Order Fulfilment Tracker
Monitor confirmed, packed, shipped, and delivered orders—split by warehouse, brand, or region.
Inventory Snapshot
Displays Available, Reserved, and Backordered stock by SKU. Perfect for detecting out-of-stock risks or overstock scenarios.
Picker Performance
Track the number of orders picked per person per hour to understand workforce productivity and training gaps.
Exception Queue Monitor
Flag delayed or failed orders for same-day review. Ideal for addressing fulfilment hiccups before they escalate.
Return Volume Insights
Use this widget to understand the volume and reasons for returns across channels. It supports proactive quality checks and reverse logistics planning.
Weekly Overview Widgets: Drive Mid-Term Operational Efficiency
On a weekly basis, you need a broader perspective. Here are the widgets to focus on:
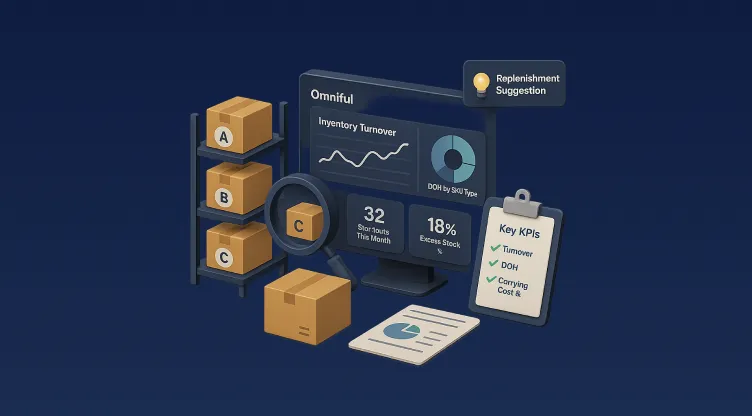
Inventory Turnover Rate
How fast are products moving? This helps optimise reorder strategies and reduce holding costs.
Order Accuracy Rate
Measures the number of correctly fulfilled orders versus total orders. Essential for QA tracking.
Shipment SLA Compliance
Evaluates how many shipments met their service level agreements. Break down by shipping provider to measure efficiency.
SKU-Level Demand Trends
Monitor your top 10 fastest-moving and slowest-moving SKUs weekly. This insight helps plan promotions and procurement.
Hub Performance Dashboard
Compare performance across dark stores or hubs: packing time, orders shipped, and issue resolution rates.
Monthly Charts: Strategic Insights That Drive Business Decisions
Zooming out monthly helps executives and supply chain heads align with business goals.
Fulfilment Cost Per Order
Includes warehousing, packing, and delivery cost data. Helps benchmark operational efficiency and spot cost-saving opportunities.
Returns by Category
Drill down into reasons for returns (damage, mismatch, expired), linked to SKU, supplier, or location.
Carrier Performance Breakdown
Chart carrier-wise delivery time, success rate, and average cost per shipment. Use this to refine shipping partnerships or automate provider selection in your Shipping Gateway.
Forecast vs. Actual Demand
Understand how well your AI-powered Supply Chain forecast matched reality. Spot trends and improve demand planning.
Dark Store Efficiency Heatmap
Use coloured performance indicators to compare multiple dark stores across KSA or GCC on key metrics like orders processed, pick-pack time, and delivery accuracy.
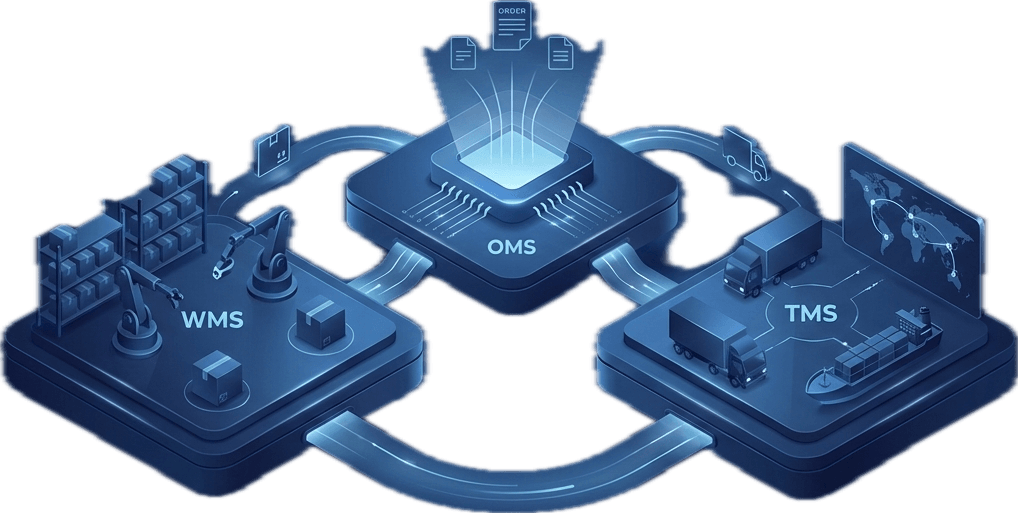
How WMS, OMS, and TMS Feed the Unified Dashboard
To get the most out of a dashboard, your systems must feed in structured and clean data. Here’s how:
Warehouse Management System (WMS)
Feeds:
- Inventory movement
- SKU cycle counts
- Bin and putaway data
- Picking route optimisation
Tool Used: Omniful’s WMS
Order Management System (OMS)
Feeds:
- Omnichannel order routing
- Backorders and express orders
- Order status transitions
- Partial fulfilments
Tool Used: Omniful OMS
Transportation Management System (TMS)
Feeds:
- Real-time shipment tracking
- Driver performance
- Route optimisation and trip clustering
- First-, mid-, and last-mile delivery metrics
Tool Used: Omniful TMS
Together, these systems power a performance-centric supply chain.
Customising Dashboards for the MENA Region
In the MENA supply chain ecosystem, challenges like localised delivery, fragmented infrastructure, and customer expectations demand precision. Here’s how a dashboard tailored for the region adds value:
- Arabic-language Support: Especially critical in KSA, UAE, and Egypt.
- Sales Channel Sync: Shopify, Zid, Salla, and WooCommerce integrations supported.
- Hyperlocal Fulfilment Tracking: Monitor same-day delivery rates across Riyadh, Jeddah, or Cairo.
- Temperature-Sensitive Delivery: Special tags and monitoring for food and pharma shipments.
With dashboards built for localisation, companies can avoid the “one-size-fits-all” trap.
Why Dashboards Are No Longer Optional
Let’s put it bluntly: if you’re not tracking your performance in real time, you’re falling behind. A dashboard:
- Brings accountability to operations
- Enables proactive action instead of reactive damage control
- Aligns cross-functional teams—from procurement to delivery
- Delivers strategic clarity for growth planning
In an age of speed, agility, and transparency, your dashboard becomes the heartbeat of your logistics engine.
Final Thought: Building Operational Intelligence
The unified dashboard is more than a tool; it’s your operating intelligence layer. It connects WMS, OMS, TMS, POS, and more. When designed well, it helps you transform operations from reactive to predictive, from manual to intelligent, and from fragmented to unified.
To explore how Omniful’s dashboard capabilities help enterprise retailers and 3PLs thrive across MENA, Request a Demo today.
Frequently Asked Questions (FAQs)
What makes a unified dashboard essential for logistics operations?
It centralises data from multiple systems, offering real-time insights that help reduce costs and increase fulfilment speed.
Can I customise widgets for different departments?
Yes. Dashboards should allow personalised views for warehouse teams, finance, and customer service.
What KPIs should I track weekly vs. daily?
Daily: order status, inventory, exceptions. Weekly: accuracy rate, turnover, picker performance.
Does Omniful support hyperlocal delivery metrics in dashboards?
Absolutely. Metrics are available down to the hub level, even for rapid delivery formats like dark stores.
How is the dashboard different from traditional ERP reports?
It offers real-time, visual insights with automated data sync—unlike traditional ERP systems that require manual inputs and batch updates.