Unified Dashboards for Supply Chain Excellence: Real-Time KPI Boards That Drive Performance

Table of Contents
Share On
Snapshot Signals – What You Need to Know
- Real-time dashboards consolidate KPIs from WMS, TMS, and OMS
- Immediate access to key metrics improves decision-making speed
- Unified view enhances collaboration across warehousing and logistics teams
- Integrated dashboards reduce operational blind spots
- Cross-channel performance is easier to measure and optimise
Introduction: Why Real-Time Visibility Matters More Than Ever
Modern supply chains are under immense pressure. Delays in data visibility, siloed systems, and outdated reporting tools are hurting performance. In the MENA region, the demand for real-time control over logistics operations is growing fast. From Riyadh to Dubai, supply chain leaders are embracing smarter ways to stay informed and act fast.
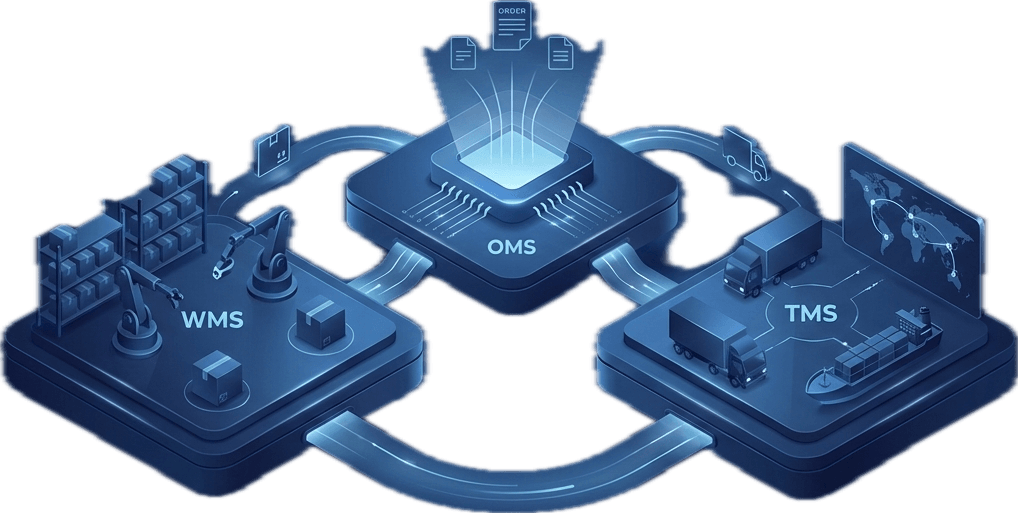
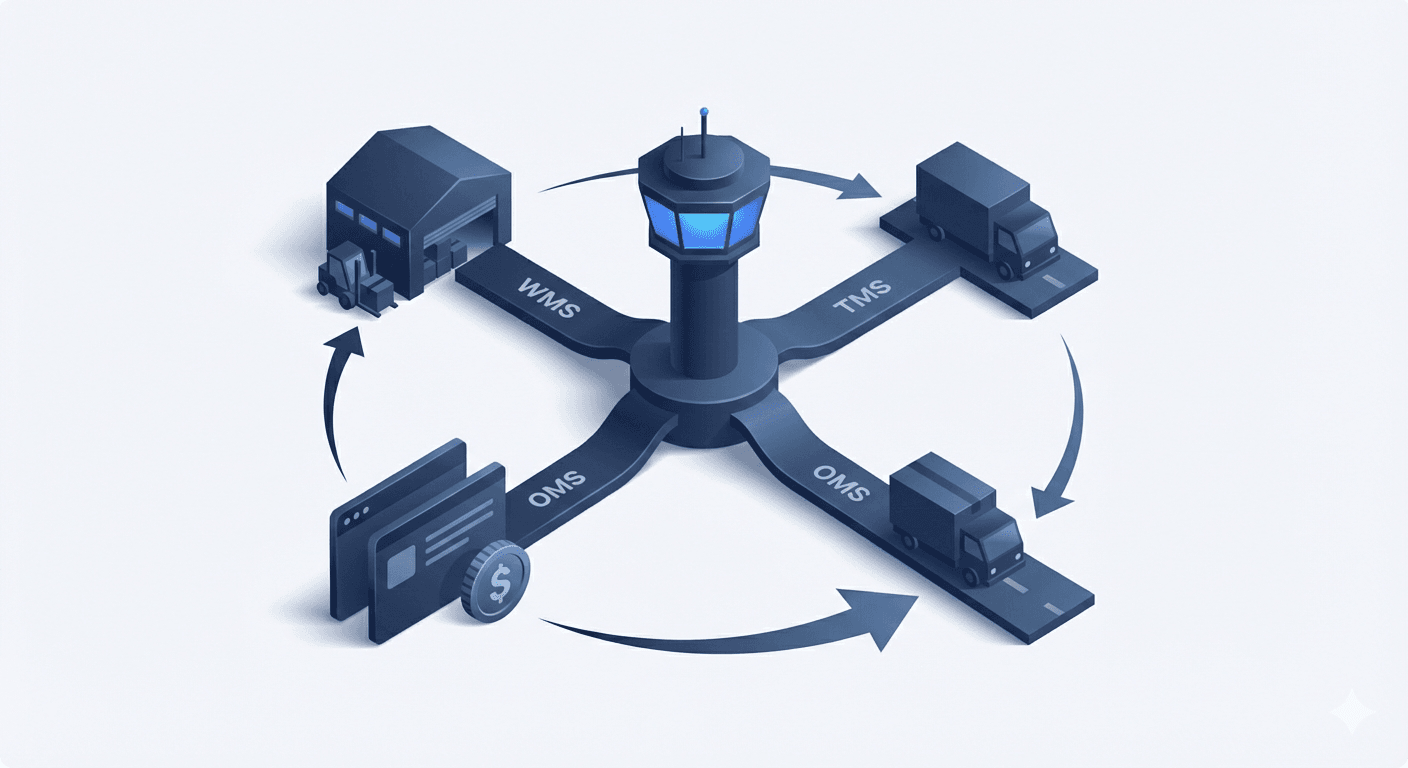
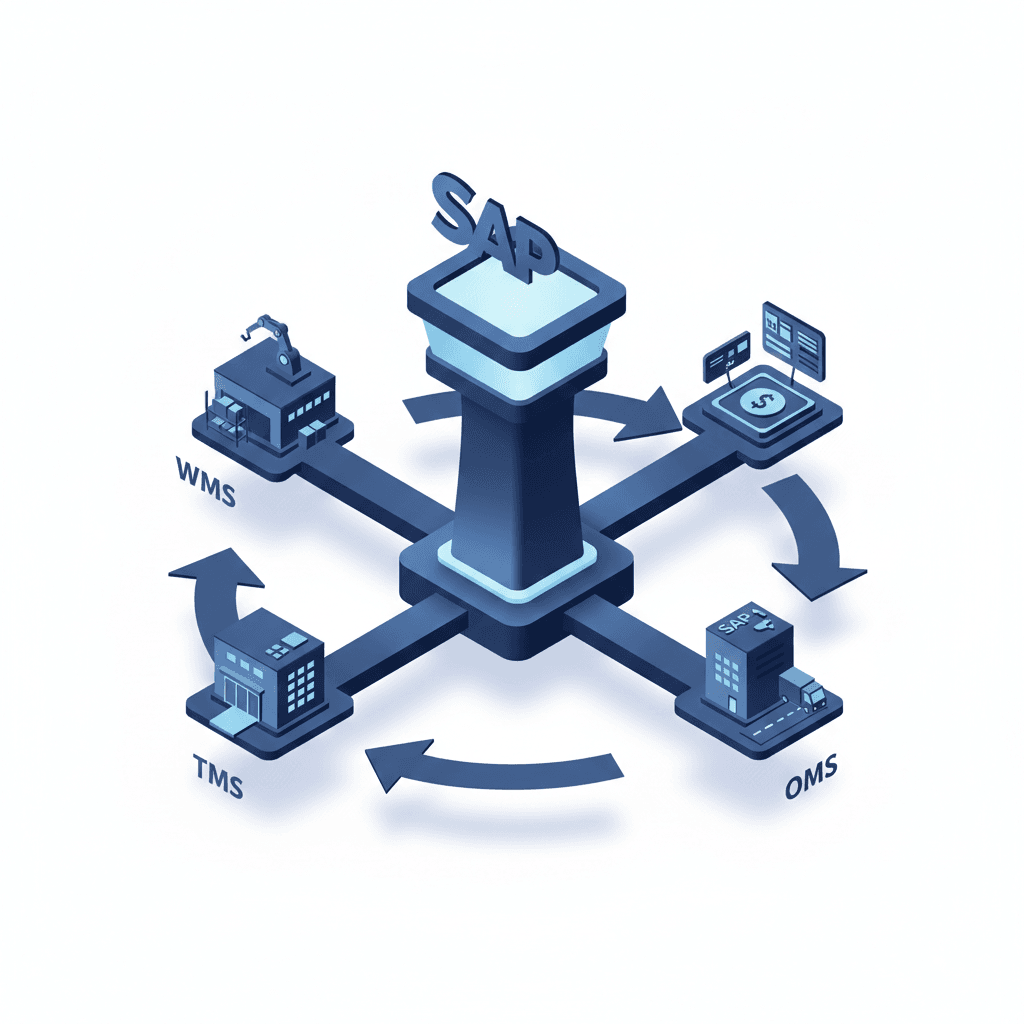
This is where unified dashboards come in. More than just a digital notice board, a real-time KPI dashboard centralises performance metrics from systems like your Warehouse Management System (WMS), Order Management System (OMS), and Transportation Management System (TMS).
These dashboards serve as live control towers. They tell supply chain teams what’s working—and what’s not—across all channels, hubs, and platforms. If a delayed shipment or inventory imbalance arises, the dashboard flags it. And if sales spike unexpectedly, you know where the pressure will land.
The Complexity Behind Multi-Channel Logistics
Logistics in today’s omnichannel world isn’t a straight line. It’s a complex web. You may be managing:
- Orders from marketplaces like Amazon and Noon
- Deliveries from local warehouses and dark stores
- Returns coming through reverse logistics flows
Each component generates its own set of data. When these data points remain isolated, you face:
- Redundant efforts from warehouse to delivery
- Missed delivery SLAs due to slow alerts
- Inaccurate inventory planning
Disconnected data leads to slow decisions. In regions like the UAE or KSA, where same-day delivery and hyperlocal models are booming, every second counts.
Real-Time KPI Dashboards: What They Actually Track
Unified dashboards pull metrics from various systems and consolidate them into one interface. Here's how each system contributes:
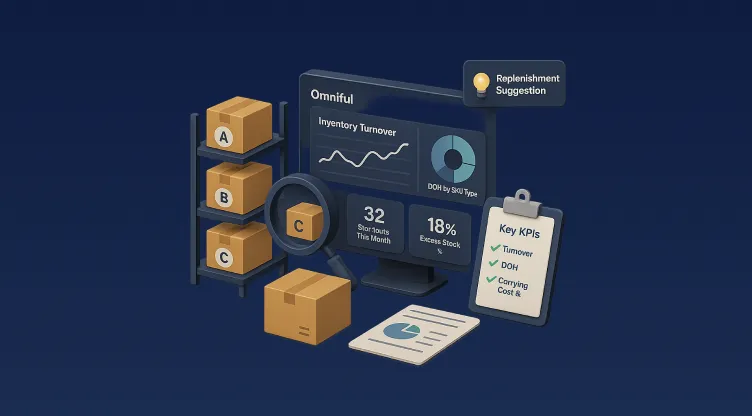
From WMS: Warehouse Health at a Glance
- Inventory turnover rates
- Picking and packing performance
- Bin utilisation and stock accuracy
- Order backlog or exceptions
This data helps warehouse managers align labour and space for efficiency.
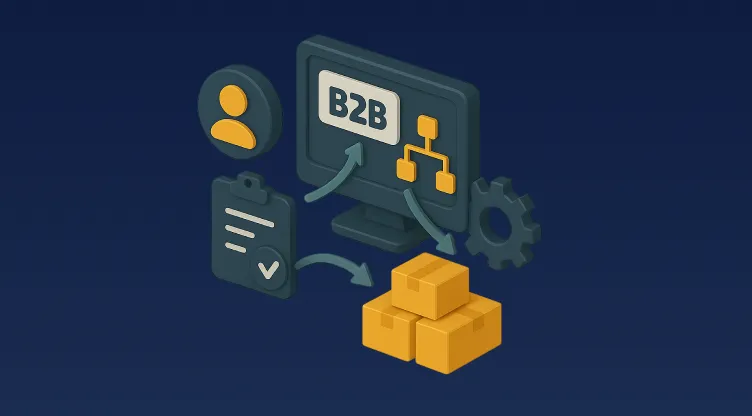
From OMS: Order Flow and Customer Experience
- Order fulfilment speed and accuracy
- Backorders and partial shipments
- Order return rates and reasons
- Sales channel performance
This makes it easier for operations and customer service teams to manage SLAs.
From TMS: Delivery in Motion
- First-mile, mid-mile, and last-mile tracking
- Route optimisation results
- Driver performance and fleet capacity
- Real-time delivery success or failure rates
Transport managers can spot issues before they escalate, like vehicle underutilisation or route delays.
All of these metrics can be visualised on one dashboard to support fast, data-driven decisions across functions.
How Unified Dashboards Solve Operational Gaps
Dashboards do more than show pretty charts. They help prevent chaos. Here's how:
Instant Alerts
Dashboards trigger alerts for anomalies, such as a sudden dip in fulfilment rate or spike in returns. This real-time feedback loop lets managers act quickly.
Better Forecasting with Predictive Insights
When powered by machine learning, these dashboards can predict:
- Stockouts before they happen
- Late deliveries due to traffic or capacity issues
- Returns that might spike due to SKU performance
This proactive approach transforms supply chain teams from reactive to strategic.
Seamless Collaboration
Sales teams see how promotions are affecting fulfilment. Operations get visibility into expected volume surges. This level of transparency reduces internal silos.
A MENA Perspective: Local Challenges, Unified Solutions
In the MENA region, companies operate in diverse ecosystems—from urban fulfilment in Dubai to rural last-mile delivery in Oman. Common challenges include:
- Language and system localisation
- Lack of standardised reporting across hubs
- Need for ZATCA-compliant POS integration
- Heavy reliance on 3PLs with fragmented data visibility
Unified dashboards are uniquely positioned to solve these problems. With plug-and-play integrations, brands in Saudi Arabia or Egypt can consolidate data from in-house systems and third-party logistics providers alike.
Platforms like Omniful’s WMS and TMS come with dashboard layers that automatically map and visualise real-time data from multiple hubs, sellers, and shipping providers.
Case Snapshot: How Laverne Group Transformed KPIs with Omniful
Laverne, a leading D2C brand in KSA, faced inconsistent service from 3PL partners and slow fulfilment cycles. With the implementation of a unified dashboard using Omniful’s OMS, WMS, and TMS:
- Order accuracy reached 100%
- Order-to-delivery time dropped from 6 days to just 2 hours
- Cost efficiency improved by eliminating 3PL dependencies
Real-time dashboards helped Laverne stay on top of every metric, from warehouse pick rates to hyperlocal delivery performance.
Features That Make Real-Time Dashboards a Must-Have
If you're exploring a dashboard solution, make sure it includes:
- Role-Based Access: Tailored views for operations, finance, and logistics
- Customisable Widgets: Choose which KPIs to display
- Mobile Optimisation: So field managers stay informed on the move
- Report Exports: Download or schedule detailed reports for stakeholders
- APIs for BI Tools: Sync data with Power BI or Tableau for deep dives
These tools are available out of the box with Omniful’s enterprise offering, making it ideal for scaleups and enterprise teams in MENA.
The Integration Advantage: One Dashboard to Rule Them All
Imagine trying to operate without visibility into what’s happening in your own warehouses or delivery vans. Fragmented views cause:
- Bottlenecks
- Customer dissatisfaction
- Cost overruns
But with Omniful, you gain a centralised view of:
Each module feeds data into your unified dashboard, ensuring consistency and traceability.
Key Benefits of Unified KPI Dashboards
Let’s break down the core benefits:
| Benefit | Description |
|---|---|
| Real-Time Monitoring | Respond instantly to issues before they impact customers |
| Faster Decision-Making | Reduce time-to-insight across logistics, warehousing, and order flow |
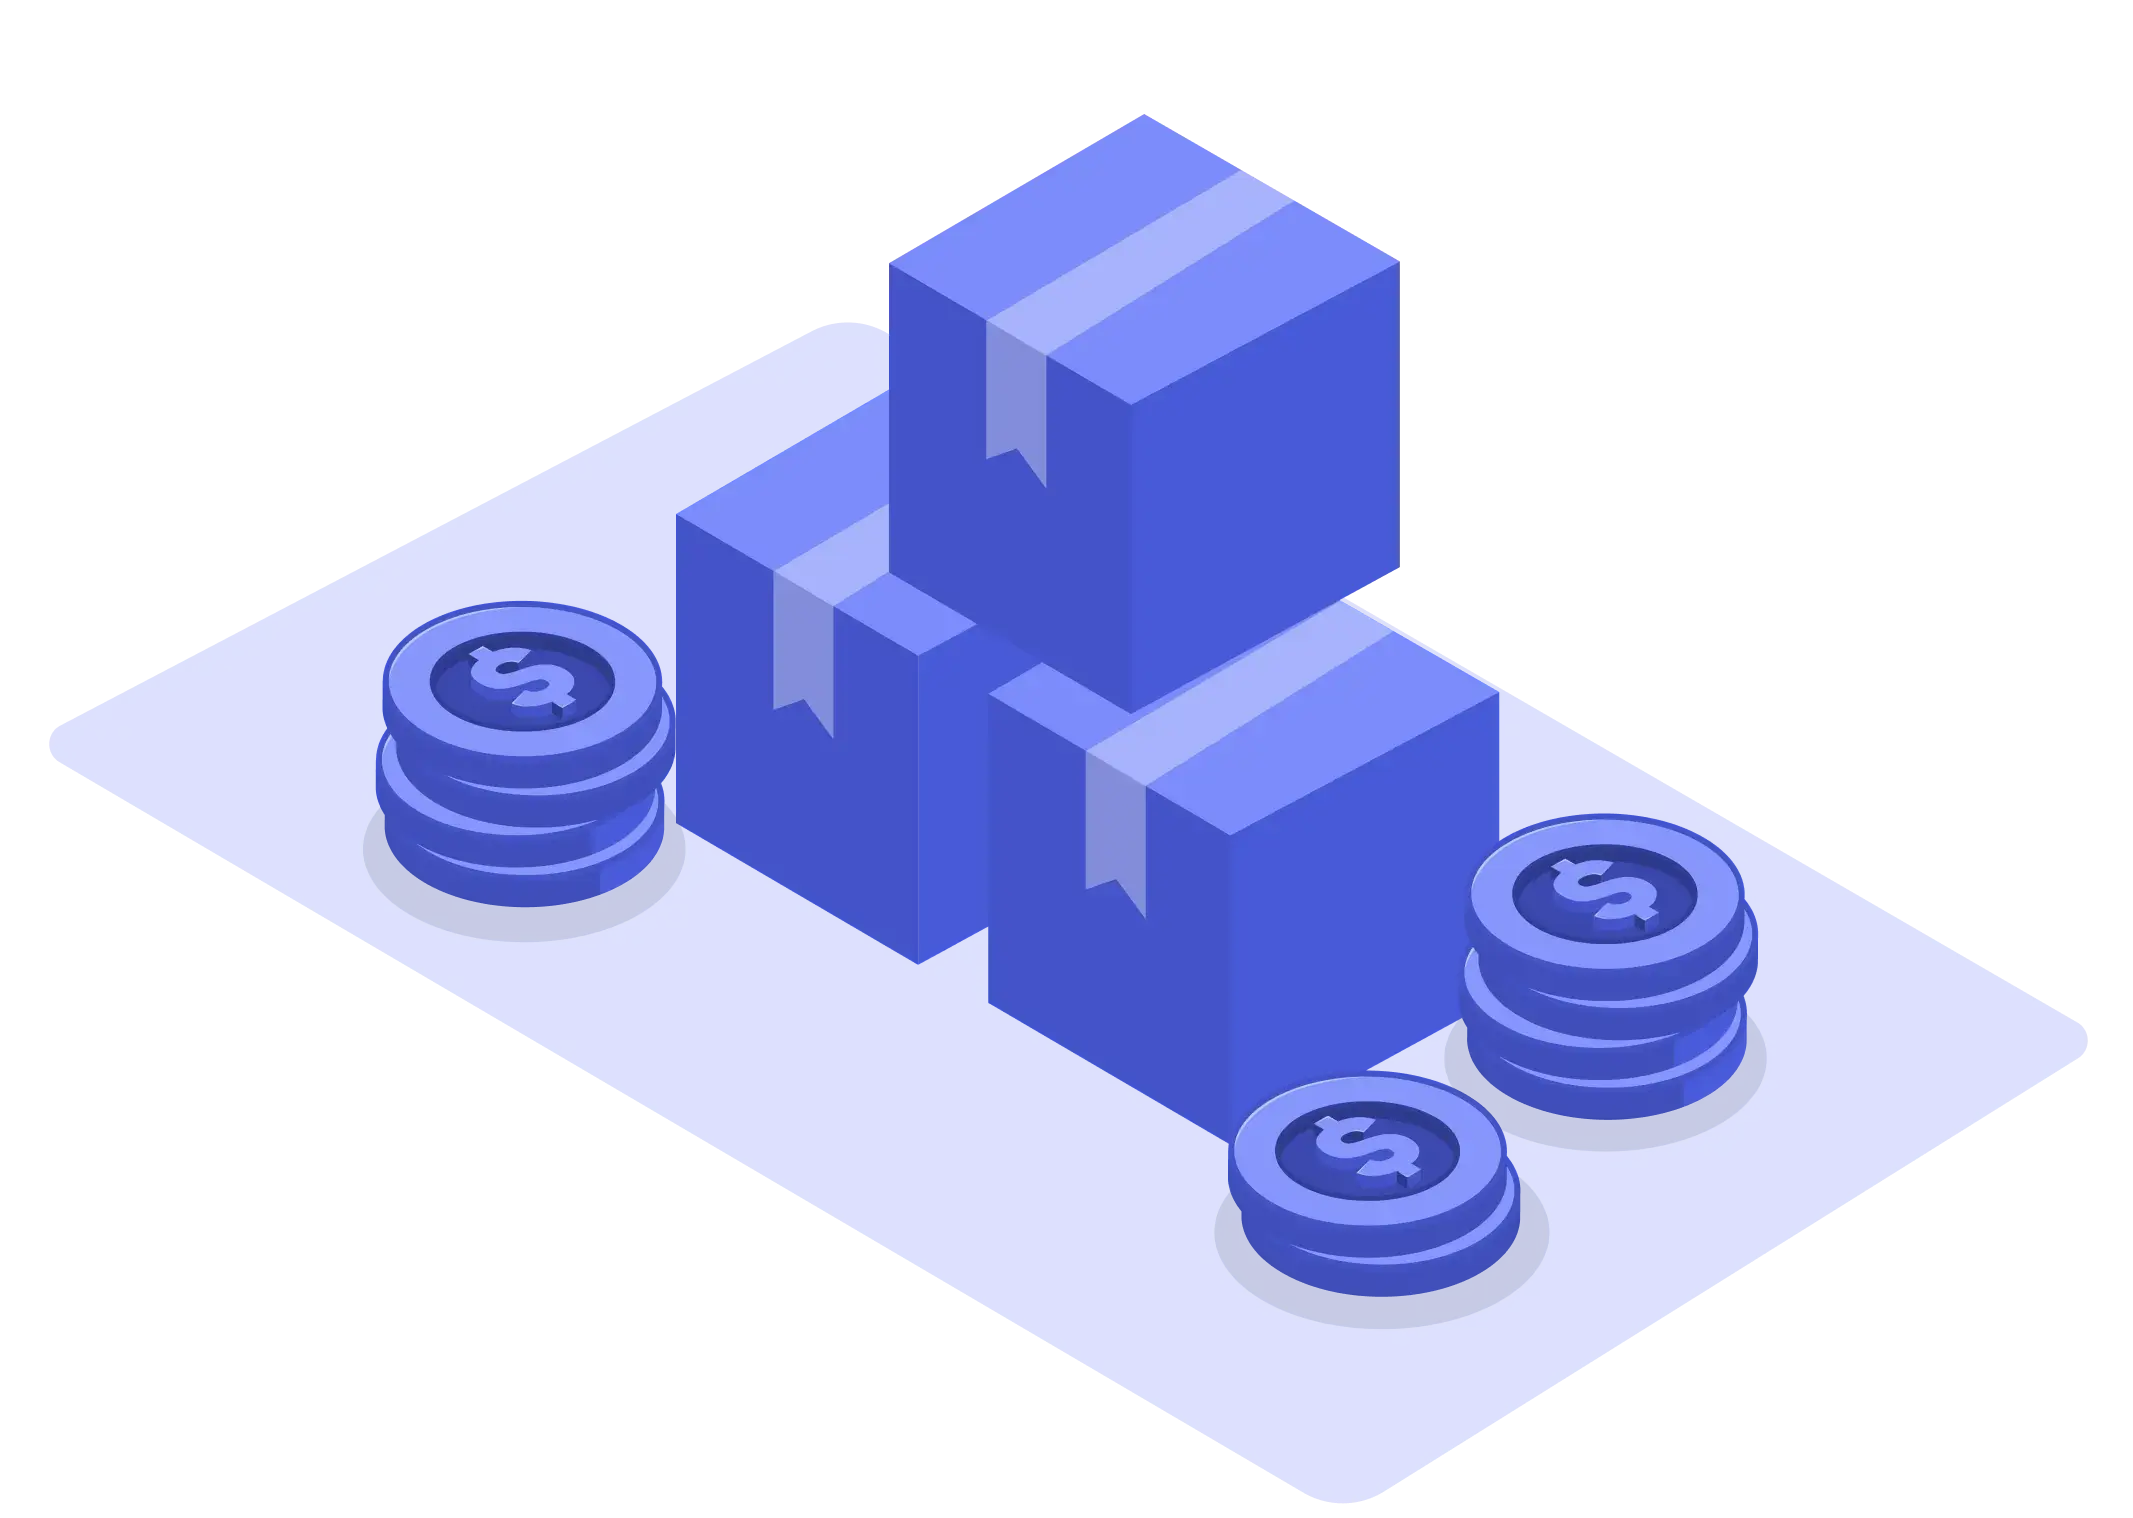
| Lower Operational Costs | Identify process inefficiencies early |
| Improved SLA Performance | Keep delivery promises and reduce penalty costs |
| Enhanced Collaboration | Align teams across functions using a single source of truth |
Future-Ready Logistics with AI-Powered Dashboards
AI is revolutionising supply chain reporting. Using historical data, Omniful’s platform can forecast trends, automate alerts, and even recommend corrective actions.
This includes:
- Demand forecasting based on regional sales spikes
- Predictive returns analysis to adjust inventory in advance
- Heatmaps of underperforming SKUs or shipping routes
As logistics in MENA becomes more competitive, the ability to act fast and smart will set leaders apart. Real-time dashboards are no longer a luxury—they are a strategic necessity.
Final Thoughts
Unified KPI dashboards empower your team with the insight and foresight needed to thrive in a fast-paced supply chain environment. Whether you manage thousands of SKUs or dozens of drivers, the ability to track, predict, and act in real-time is your competitive edge.
If your operations still depend on manual reporting or disconnected systems, now is the time to switch.
Call to Action
👉 Request a Demo
👉 See Omniful in Action
FAQs
What makes a unified dashboard different from traditional reporting tools?
Traditional tools offer static reports. Unified dashboards deliver real-time, interactive data from multiple sources like WMS, OMS, and TMS.
Can I integrate third-party tools with Omniful’s dashboard?
Yes, Omniful offers plug-and-play integrations for smooth onboarding with external systems and APIs for analytics tools.
Is this solution scalable for large retailers and fulfilment providers?
Absolutely. Omniful powers enterprise clients across 15 countries, managing high-order volumes and complex multi-channel workflows.
Can I track returns and delivery failures in real-time?
Yes. Features like reverse logistics flows and failure reason dashboards ensure accurate reporting on every delivery leg.